

具體描述
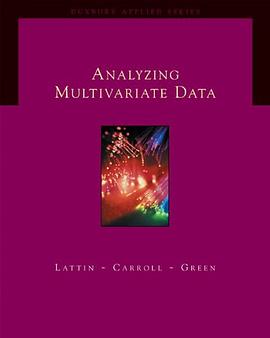
本書是一本麵嚮應用的經典多元數據分析教材,自1979年齣版第1版至今,深受讀者好評。本書循序漸進地介紹瞭各種多元統計分析方法,並通過豐富的實例演示瞭這些方法的應用。書中不僅涵蓋多元數據分析的基本方法,而且還介紹瞭一些新方法,如結構方程建模和偏最小二乘法等。
本書特色
以循序漸進方式(流水綫方式)組織內容:在內容組織上,各章集中概述一個論題,每章均從基礎開始並討論應用,後麵各章逐步深入。
擴展各種方法應用:對“經驗法則”給齣解釋,包括像樣本容量這類重要問題。
重新組織結構方程建模這一重要內容,包括結構方程建模概述、驗證性因素分析、估計和檢驗結構模型的相關問題,以及驗證性因素分析和結構方程建模的一些高級主題,如檢驗更高階因子模型、群組模型、調節變量與中間變量。
著者簡介
Joseph F. Hair 於1971獲得佛羅裏達大學市場營銷博士學位,現為肯尼索州立大學市場營銷係教授。他齣版瞭四十多本書,包括《Marketing》、《Marketing Essentials》等。他是美國市場營銷協會、市場營銷科學學會、西南市場營銷協會和南方市場營銷學會委員。2004年他被美國市場營銷科學學會授予傑齣教育奬,2007年被市場管理協會授予創新性市場營銷人纔。
William C. Black 於1980年獲得德州大學奧斯汀分校博士學位,現為路易斯安那州立大學工商管理學院市場營銷係教授。他的研究興趣包括多元統計、應用信息技術,以及與電子商務相關的市場原理的進展。他是《Journal of Business Research》編審委員會成員。
Barry J. Babin 於1991年獲得路易斯安那州立大學工商管理學博士學位,現為路易斯安那理工大學市場營銷與定量分析學教授、商學院Max P. Watson教授。他主要研究零售的各個方麵和服務管理。他還曾被美國市場營銷科學研究院和市場營銷學會評為傑齣研究員。
Rolph E. Anderson 擁有佛羅裏達大學博士學位,現為Drexel大學工商管理學院Royal H. Gibson Sr教授。他曾兩次獲得Drexel大學優秀教師奬,並獲得過《Journal of Personal Selling & Sales Management》傑齣評論奬、Drexel大學商學院科研成就奬等。
圖書目錄
Preface iii
About the Authors v
Chapter 1 Introduction: Methods and Model Building 1
What Is Multivariate Analysis? 3
Multivariate Analysis in Statistical Terms 4
Some Basic Concepts of Multivariate Analysis 4
The Variate 4
Measurement Scales 5
Measurement Error and Multivariate Measurement 7
Statistical Significance Versus Statistical Power 8
Types of Statistical Error and Statistical Power 9
Impacts on Statistical Power 9
Using Power with Multivariate Techniques 11
A Classification of Multivariate Techniques 11
Dependence Techniques 14
Interdependence Techniques 14
Types of Multivariate Techniques 15
Principal Components and Common Factor Analysis 16
Multiple Regression 16
Multiple Discriminant Analysis and Logistic Regression 16
Canonical Correlation 17
Multivariate Analysis of Variance and Covariance 17
Conjoint Analysis 18
Cluster Analysis 18
Perceptual Mapping 19
Correspondence Analysis 19
Structural Equation Modeling and Confirmatory Factor Analysis 19
Guidelines for Multivariate Analyses and Interpretation 20
Establish Practical Significance as Well as Statistical
Significance 20
Recognize That Sample Size Affects All Results 21
Know Your Data 21
Strive for Model Parsimony 21
Look at Your Errors 22
Validate Your Results 22
A Structured Approach to Multivariate Model Building 22
Stage 1: Define the Research Problem, Objectives,
and Multivariate Technique to Be Used 23
Stage 2: Develop the Analysis Plan 23
Stage 3: Evaluate the Assumptions Underlying the Multivariate Technique 23
Stage 4: Estimate the Multivariate Model and Assess Overall Model Fit 23
Stage 5: Interpret the Variate(s) 24
Stage 6: Validate the Multivariate Model 24
A Decision Flowchart 24
Databases 24
Primary Database 25
Other Databases 27
Organization of the Remaining Chapters 28
Section I: Understanding and Preparing For Multivariate Analysis 28
Section II: Analysis Using Dependence Techniques 28
Section III: Interdependence Techniques 28
Section IV: Structural Equations Modeling 28
Summary 28 . Questions 30 . Suggested Readings 30
References 30
SECTION I Understanding and Preparing For Multivariate Analysis 31
Chapter 2 Cleaning and Transforming Data 33
Introduction 36
Graphical Examination of the Data 37
Univariate Profiling: Examining the Shape of the Distribution 38
Bivariate Profiling: Examining the Relationship Between Variables 39
Bivariate Profiling: Examining Group Differences 40
Multivariate Profiles 41
Missing Data 42
The Impact of Missing Data 42
A Simple Example of a Missing Data Analysis 43
A Four-Step Process for Identifying Missing Data and Applying Remedies 44
An Illustration of Missing Data Diagnosis with the Four-Step Process 54
Outliers 64
Detecting and Handling Outliers 65
An Illustrative Example of Analyzing Outliers 68
Testing the Assumptions of Multivariate Analysis 70
Assessing Individual Variables Versus the Variate 70
Four Important Statistical Assumptions 71
Data Transformations 77
An Illustration of Testing the Assumptions Underlying Multivariate Analysis 79
Incorporating Nonmetric Data with Dummy Variables 86
Summary 88 . Questions 89 . Suggested Readings 89
References 90
Chapter 3 Factor Analysis 91
What Is Factor Analysis? 94
A Hypothetical Example of Factor Analysis 95
Factor Analysis Decision Process 96
Stage 1: Objectives of Factor Analysis 96
Specifying the Unit of Analysis 98
Achieving Data Summarization Versus Data Reduction 98
Variable Selection 99
Using Factor Analysis with Other Multivariate Techniques 100
Stage 2: Designing a Factor Analysis 100
Correlations Among Variables or Respondents 100
Variable Selection and Measurement Issues 101
Sample Size 102
Summary 102
Stage 3: Assumptions in Factor Analysis 103
Conceptual Issues 103
Statistical Issues 103
Summary 104
Stage 4: Deriving Factors and Assessing Overall Fit 105
Selecting the Factor Extraction Method 105
Criteria for the Number of Factors to Extract 108
Stage 5: Interpreting the Factors 112
The Three Processes of Factor Interpretation 112
Rotation of Factors 113
Judging the Significance of Factor Loadings 116
Interpreting a Factor Matrix 118
Stage 6: Validation of Factor Analysis 122
Use of a Confirmatory Perspective 122
Assessing Factor Structure Stability 122
Detecting Influential Observations 123
Stage 7: Additional Uses of Factor Analysis Results 123
Selecting Surrogate Variables for Subsequent Analysis 123
Creating Summated Scales 124
Computing Factor Scores 127
Selecting Among the Three Methods 128
An Illustrative Example 129
Stage 1: Objectives of Factor Analysis 129
Stage 2: Designing a Factor Analysis 129
Stage 3: Assumptions in Factor Analysis 129
Component Factor Analysis: Stages 4 Through 7 132
Common Factor Analysis: Stages 4 and 5 144
A Managerial Overview of the Results 146
Summary 148 . Questions 150 . Suggested Readings 150
References 150
SECTION II Analysis Using Dependence Techniques 153
Chapter 4 Simple and Multiple Regression 155
What Is Multiple Regression Analysis? 161
An Example of Simple and Multiple Regression 162
Prediction Using a Single Independent Variable:
Simple Regression 162
Prediction Using Several Independent Variables:
Multiple Regression 165
Summary 167
A Decision Process for Multiple Regression Analysis 167
Stage 1: Objectives of Multiple Regression 169
Research Problems Appropriate for Multiple Regression 169
Specifying a Statistical Relationship 171
Selection of Dependent and Independent Variables 171
Stage 2: Research Design of a Multiple Regression Analysis 173
Sample Size 174
Creating Additional Variables 176
Stage 3: Assumptions in Multiple Regression Analysis 181
Assessing Individual Variables Versus the Variate 182
Methods of Diagnosis 183
Linearity of the Phenomenon 183
Constant Variance of the Error Term 185
Independence of the Error Terms 185
Normality of the Error Term Distribution 185
Summary 186
Stage 4: Estimating the Regression Model and Assessing Overall Model Fit 186
Selecting an Estimation Technique 186
Testing the Regression Variate for Meeting the Regression Assumptions 191
Examining the Statistical Significance of Our Model 192
Identifying Influential Observations 194
Stage 5: Interpreting the Regression Variate 197
Using the Regression Coefficients 197
Assessing Multicollinearity 200
Stage 6: Validation of the Results 206
Additional or Split Samples 206
Calculating the PRESS Statistic 206
Comparing Regression Models 206
Forecasting with the Model 207
Illustration of a Regression Analysis 207
Stage 1: Objectives of Multiple Regression 207
Stage 2: Research Design of a Multiple Regression Analysis 208
Stage 3: Assumptions in Multiple Regression Analysis 208
Stage 4: Estimating the Regression Model and Assessing Overall Model Fit 208
Stage 5: Interpreting the Regression Variate 223
Stage 6: Validating the Results 226
Evaluating Alternative Regression Models 227
A Managerial Overview of the Results 231
Summary 231 . Questions 234 . Suggested Readings 234
References 234
Chapter 5 Canonical Correlation 235
What Is Canonical Correlation? 237
Hypothetical Example of Canonical Correlation 238
Developing a Variate of Dependent Variables 238
Estimating the First Canonical Function 238
Estimating a Second Canonical Function 240
Relationships of Canonical Correlation Analysis to Other Multivariate Techniques 241
Stage 1: Objectives of Canonical Correlation Analysis 242
Selection of Variable Sets 242
Evaluating Research Objectives 242
Stage 2: Designing a Canonical Correlation Analysis 243
Sample Size 243
Variables and Their Conceptual Linkage 243
Missing Data and Outliers 244
Stage 3: Assumptions in Canonical Correlation 244
Linearity 244
Normality 244
Homoscedasticity and Multicollinearity 244
Stage 4: Deriving the Canonical Functions and Assessing Overall Fit 245
Deriving Canonical Functions 246
Which Canonical Functions Should Be Interpreted? 246
Stage 5: Interpreting the Canonical Variate 250
Canonical Weights 250
Canonical Loadings 250
Canonical Cross-Loadings 250
Which Interpretation Approach to Use 251
Stage 6: Validation and Diagnosis 251
An Illustrative Example 252
Stage 1: Objectives of Canonical Correlation Analysis 253
Stages 2 and 3: Designing a Canonical Correlation Analysis and Testing the Assumptions 253
Stage 4: Deriving the Canonical Functions and Assessing Overall Fit 253
Stage 5: Interpreting the Canonical Variates 254
Stage 6: Validation and Diagnosis 257
A Managerial Overview of the Results 258
Summary 258 . Questions 259 . References 260
Chapter 6 Conjoint Analysis 261
What Is Conjoint Analysis? 266
Hypothetical Example of Conjoint Analysis 267
Specifying Utility, Factors, Levels, and Profiles 267
Gathering Preferences from Respondents 268
Estimating Part-Worths 269
Determining Attribute Importance 270
Assessing Predictive Accuracy 270
The Managerial Uses of Conjoint Analysis 271
Comparing Conjoint Analysis with Other Multivariate Methods 272
Compositional Versus Decompositional Techniques 272
Specifying the Conjoint Variate 272
Separate Models for Each Individual 272
Flexibility in Types of Relationships 273
Designing a Conjoint Analysis Experiment 273
Stage 1: The Objectives of Conjoint Analysis 276
Defining the Total Utility of the Object 276
Specifying the Determinant Factors 276
Stage 2: The Design of a Conjoint Analysis 277
Selecting a Conjoint Analysis Methodology 278
Designing Profiles: Selecting and Defining Factors and Levels 278
Specifying the Basic Model Form 283
Data Collection 286
Stage 3: Assumptions of Conjoint Analysis 293
Stage 4: Estimating the Conjoint Model and Assessing Overall Fit 294
Selecting an Estimation Technique 294
Estimated Part-Worths 297
Evaluating Model Goodness-of-Fit 298
Stage 5: Interpreting the Results 299
Examining the Estimated Part-Worths 300
Assessing the Relative Importance of Attributes 302
Stage 6: Validation of the Conjoint Results 303
Managerial Applications of Conjoint Analysis 303
Segmentation 304
Profitability Analysis 304
Conjoint Simulators 305
Alternative Conjoint Methodologies 306
Adaptive/Self-Explicated Conjoint: Conjoint with
a Large Number of Factors 306
Choice-Based Conjoint: Adding Another Touch of Realism 308
Overview of the Three Conjoint Methodologies 312
An Illustration of Conjoint Analysis 312
Stage 1: Objectives of the Conjoint Analysis 313
Stage 2: Design of the Conjoint Analysis 313
Stage 3: Assumptions in Conjoint Analysis 316
Stage 4: Estimating the Conjoint Model and Assessing Overall Model Fit 316
Stage 5: Interpreting the Results 320
Stage 6: Validation of the Results 324
A Managerial Application: Use of a Choice Simulator 325
Summary 327 . Questions 330 . Suggested Readings 330
References 330
Chapter 7 Multiple Discriminant Analysis and Logistic Regression 335
What Are Discriminant Analysis and Logistic Regression? 339
Discriminant Analysis 340
Logistic Regression 341
Analogy with Regression and MANOVA 341
Hypothetical Example of Discriminant Analysis 342
A Two-Group Discriminant Analysis: Purchasers Versus Nonpurchasers 342
A Geometric Representation of the Two-Group Discriminant Function 345
A Three-Group Example of Discriminant Analysis: Switching Intentions 346
The Decision Process for Discriminant Analysis 348
Stage 1: Objectives of Discriminant Analysis 350
Stage 2: Research Design for Discriminant Analysis 351
Selecting Dependent and Independent Variables 351
Sample Size 353
Division of the Sample 353
Stage 3: Assumptions of Discriminant Analysis 354
Impacts on Estimation and Classification 354
Impacts on Interpretation 355
Stage 4: Estimation of the Discriminant Model and Assessing Overall Fit 356
Selecting an Estimation Method 356
Statistical Significance 358
Assessing Overall Model Fit 359
Casewise Diagnostics 368
Stage 5: Interpretation of the Results 369
Discriminant Weights 369
Discriminant Loadings 370
Partial F Values 370
Interpretation of Two or More Functions 370
Which Interpretive Method to Use? 373
Stage 6: Validation of the Results 373
Validation Procedures 373
Profiling Group Differences 374
A Two-Group Illustrative Example 375
Stage 1: Objectives of Discriminant Analysis 375
Stage 2: Research Design for Discriminant Analysis 375
Stage 3: Assumptions of Discriminant Analysis 376
Stage 4: Estimation of the Discriminant Model and Assessing Overall Fit 376
Stage 5: Interpretation of the Results 387
Stage 6: Validation of the Results 390
A Managerial Overview 391
A Three-Group Illustrative Example 391
Stage 1: Objectives of Discriminant Analysis 391
Stage 2: Research Design for Discriminant Analysis 392
Stage 3: Assumptions of Discriminant Analysis 392
Stage 4: Estimation of the Discriminant Model and Assessing Overall Fit 392
Stage 5: Interpretation of Three-Group Discriminant Analysis Results 404
Stage 6: Validation of the Discriminant Results 410
A Managerial Overview 412
Logistic Regression: Regression with a Binary Dependent Variable 413
Representation of the Binary Dependent Variable 414
Sample Size 415
Estimating the Logistic Regression Model 416
Assessing the Goodness-of-Fit of the Estimation Model 419
Testing for Significance of the Coefficients 421
Interpreting the Coefficients 422
Calculating Probabilities for a Specific Value of the Independent Variable 425
Overview of Interpreting Coefficients 425
Summary 425
An Illustrative Example of Logistic Regression 426
Stages 1, 2, and 3: Research Objectives, Research Design, and Statistical Assumptions 426
Stage 4: Estimation of the Logistic Regression Model and Assessing Overall Fit 426
Stage 5: Interpretation of the Results 432
Stage 6: Validation of the Results 433
A Managerial Overview 434
Summary 434 . Questions 437 . Suggested Readings 437
References 437
Chapter 8 ANOVA and MANOVA 439
MANOVA: Extending Univariate Methods for Assessing Group Differences 443
Multivariate Procedures for Assessing Group Differences 444
A Hypothetical Illustration of MANOVA 447
Analysis Design 447
Differences from Discriminant Analysis 448
Forming the Variate and Assessing Differences 448
A Decision Process for MANOVA 449
Stage 1: Objectives of MANOVA 450
When Should We Use MANOVA? 450
Types of Multivariate Questions Suitable for MANOVA 451
Selecting the Dependent Measures 452
Stage 2: Issues in the Research Design of MANOVA 453
Sample Size Requirements—Overall and by Group 453
Factorial Designs—Two or More Treatments 453
Using Covariates—ANCOVA and MANCOVA 455
MANOVA Counterparts of Other ANOVA Designs 457
A Special Case of MANOVA: Repeated Measures 457
Stage 3: Assumptions of ANOVA and MANOVA 458
Independence 458
Equality of Variance–Covariance Matrices 459
Normality 460
Linearity and Multicollinearity Among the Dependent Variables 460
Sensitivity to Outliers 460
Stage 4: Estimation of the MANOVA Model and Assessing Overall Fit 460
Estimation with the General Linear Model 462
Criteria for Significance Testing 463
Statistical Power of the Multivariate Tests 463
Stage 5: Interpretation of the MANOVA Results 468
Evaluating Covariates 468
Assessing Effects on the Dependent Variate 468
Identifying Differences Between Individual Groups 472
Assessing Significance for Individual Dependent Variables 474
Stage 6: Validation of the Results 475
Summary 476
Illustration of a MANOVA Analysis 476
Example 1: Difference Between Two Independent Groups 477
Stage 1: Objectives of the Analysis 478
Stage 2: Research Design of the MANOVA 478
Stage 3: Assumptions in MANOVA 479
Stage 4: Estimation of the MANOVA Model and Assessing the Overall Fit 480
Stage 5: Interpretation of the Results 482
Example 2: Difference Between K Independent Groups 482
Stage 1: Objectives of the MANOVA 483
Stage 2: Research Design of MANOVA 483
Stage 3: Assumptions in MANOVA 484
Stage 4: Estimation of the MANOVA Model and Assessing Overall Fit 485
Stage 5: Interpretation of the Results 485
Example 3: A Factorial Design for MANOVA with Two Independent Variables 488
Stage 1: Objectives of the MANOVA 489
Stage 2: Research Design of the MANOVA 489
Stage 3: Assumptions in MANOVA 491
Stage 4: Estimation of the MANOVA Model and Assessing Overall Fit 492
Stage 5: Interpretation of the Results 495
Summary 496
A Managerial Overview of the Results 496
Summary 498 . Questions 500 . Suggested Readings 500
References 500
SECTION III Analysis Using Interdependence Techniques 503
Chapter 9 Grouping Data with Cluster Analysis 505
What Is Cluster Analysis? 508
Cluster Analysis as a Multivariate Technique 508
Conceptual Development with Cluster Analysis 508
Necessity of Conceptual Support in Cluster Analysis 509
How Does Cluster Analysis Work? 510
A Simple Example 510
Objective Versus Subjective Considerations 515
Cluster Analysis Decision Process 515
Stage 1: Objectives of Cluster Analysis 517
Stage 2: Research Design in Cluster Analysis 518
Stage 3: Assumptions in Cluster Analysis 526
Stage 4: Deriving Clusters and Assessing Overall Fit 527
Stage 5: Interpretation of the Clusters 538
Stage 6: Validation and Profiling of the Clusters 539
An Illustrative Example 541
Stage 1: Objectives of the Cluster Analysis 541
Stage 2: Research Design of the Cluster Analysis 542
Stage 3: Assumptions in Cluster Analysis 545
Employing Hierarchical and Nonhierarchical Methods 546
Step 1: Hierarchical Cluster Analysis (Stage 4) 546
Step 2: Nonhierarchical Cluster Analysis (Stages 4, 5, and 6) 552
Summary 561 . Questions 563 . Suggested Readings 563
References 563
Chapter 10 MDS and Correspondence Analysis 565
What Is Multidimensional Scaling? 568
Comparing Objects 568
Dimensions: The Basis for Comparison 569
A Simplified Look at How MDS Works 570
Gathering Similarity Judgments 570
Creating a Perceptual Map 570
Interpreting the Axes 571
Comparing MDS to Other Interdependence Techniques 572
Individual as the Unit of Analysis 573
Lack of a Variate 573
A Decision Framework for Perceptual Mapping 573
Stage 1: Objectives of MDS 573
Key Decisions in Setting Objectives 573
Stage 2: Research Design of MDS 578
Selection of Either a Decompositional (Attribute-Free)
or Compositional (Attribute-Based) Approach 578
Objects: Their Number and Selection 580
Nonmetric Versus Metric Methods 581
Collection of Similarity or Preference Data 581
Stage 3: Assumptions of MDS Analysis 584
Stage 4: Deriving the MDS Solution and Assessing Overall Fit 584
Determining an Object’s Position in the Perceptual Map 584
Selecting the Dimensionality of the Perceptual Map 586
Incorporating Preferences into MDS 587
Stage 5: Interpreting the MDS Results 592
Identifying the Dimensions 593
Stage 6: Validating the MDS Results 594
Issues in Validation 594
Approaches to Validation 594
Overview of Multidimensional Scaling 595
Correspondence Analysis 595
Distinguishing Characteristics 595
Differences from Other Multivariate Techniques 596
A Simple Example of CA 596
A Decision Framework for Correspondence Analysis 600
Stage 1: Objectives of CA 601
Stage 2: Research Design of CA 601
Stage 3: Assumptions in CA 602
Stage 4: Deriving CA Results and Assessing Overall Fit 602
Stage 5: Interpretation of the Results 603
Stage 6: Validation of the Results 604
Overview of Correspondence Analysis 604
Illustrations of MDS and Correspondence Analysis 605
Stage 1: Objectives of Perceptual Mapping 606
Identifying Objects for Inclusion 606
Basing the Analysis on Similarity or Preference Data 607
Using a Disaggregate or Aggregate Analysis 607
Stage 2: Research Design of the Perceptual Mapping Study 607
Selecting Decompositional or Compositional Methods 607
Selecting Firms for Analysis 608
Nonmetric Versus Metric Methods 608
Collecting Data for MDS 608
Collecting Data for Correspondence Analysis 609
Stage 3: Assumptions in Perceptual Mapping 610
Multidimensional Scaling: Stages 4 and 5 610
Stage 4: Deriving MDS Results and Assessing Overall Fit 610
Stage 5: Interpretation of the Results 615
Overview of the Decompositional Results 616
Correspondence Analysis: Stages 4 and 5 617
Stage 4: Estimating a Correspondence Analysis 617
Stage 5: Interpreting CA Results 619
Overview of CA 621
Stage 6: Validation of the Results 622
A Managerial Overview of MDS Results 622
Summary 623 . Questions 625 . Suggested Readings 625
References 625
SECTION IV Structural Equations Modeling 627
Chapter 11 SEM: An Introduction 629
What Is Structural Equation Modeling? 634
Estimation of Multiple Interrelated Dependence Relationships 635
Incorporating Latent Variables Not Measured Directly 635
Defining a Model 637
SEM and Other Multivariate Techniques 641
Similarity to Dependence Techniques 641
Similarity to Interdependence Techniques 641
The Emergence of SEM 642
The Role of Theory in Structural Equation Modeling 642
Specifying Relationships 642
Establishing Causation 643
Developing a Modeling Strategy 646
A Simple Example of SEM 647
The Research Question 647
Setting Up the Structural Equation Model for Path Analysis 648
The Basics of SEM Estimation and Assessment 649
Six Stages in Structural Equation Modeling 653
Stage 1: Defining Individual Constructs 655
Operationalizing the Construct 655
Pretesting 655
Stage 2: Developing and Specifying the Measurement Model 656
SEM Notation 656
Creating the Measurement Model 657
Stage 3: Designing a Study to Produce Empirical Results 657
Issues in Research Design 658
Issues in Model Estimation 662
Stage 4: Assessing Measurement Model Validity 664
The Basics of Goodness-of-Fit 665
Absolute Fit Indices 666
Incremental Fit Indices 668
Parsimony Fit Indices 669
Problems Associated with Using Fit Indices 669
Unacceptable Model Specification to Achieve Fit 671
Guidelines for Establishing Acceptable and Unacceptable Fit 672
Stage 5: Specifying the Structural Model 673
Stage 6: Assessing the Structural Model Validity 675
Structural Model GOF 675
Competitive Fit 676
Comparison to the Measurement Model 676
Testing Structural Relationships 677
Summary 678 . Questions 680 . Suggested Readings 680
Appendix 11A: Estimating Relationships Using Path Analysis 681
Appendix 11B: SEM Abbreviations 683
Appendix 11C: Detail on Selected GOF Indices 684
References 685
Chapter 12 Applications of SEM 687
Part 1: Confirmatory Factor Analysis 693
CFA and Exploratory Factor Analysis 693
A Simple Example of CFA and SEM 694
A Visual Diagram 694
SEM Stages for Testing Measurement Theory Validation with CFA 695
Stage 1: Defining Individual Constructs 696
Stage 2: Developing the Overall Measurement Model 696
Unidimensionality 696
Congeneric Measurement Model 698
Items per Construct 698
Reflective Versus Formative Constructs 701
Stage 3: Designing a Study to Produce Empirical Results 702
Measurement Scales in CFA 702
SEM and Sampling 703
Specifying the Model 703
Issues in Identification 704
Avoiding Identification Problems 704
Problems in Estimation 706
Stage 4: Assessing Measurement Model Validity 707
Assessing Fit 707
Path Estimates 707
Construct Validity 708
Model Diagnostics 711
Summary Example 713
CFA Illustration 715
Stage 1: Defining Individual Constructs 716
Stage 2: Developing the Overall Measurement Model 716
Stage 3: Designing a Study to Produce Empirical Results 718
Stage 4: Assessing Measurement Model Validity 719
HBAT CFA Summary 727
Part 2: What Is a Structural Model? 727
A Simple Example of a Structural Model 728
An Overview of Theory Testing with SEM 729
Stages in Testing Structural Theory 730
One-Step Versus Two-Step Approaches 730
Stage 5: Specifying the Structural Model 731
Unit of Analysis 731
Model Specification Using a Path Diagram 731
Designing the Study 735
Stage 6: Assessing the Structural Model Validity 737
Understanding Structural Model Fit from CFA Fit 737
Examine the Model Diagnostics 739
SEM Illustration 740
Stage 5: Specifying the Structural Model 740
Stage 6: Assessing the Structural Model Validity 742
Part 3: Extensions and Applications of SEM 749
Reflective Versus Formative Measures 749
Reflective Versus Formative Measurement Theory 749
Operationalizing a Formative Construct 750
Distinguishing Reflective from Formative Constructs 751
Which to Use—Reflective or Formative? 753
Higher-Order Factor Analysis 754
Empirical Concerns 754
Theoretical Concerns 756
Using Second-Order Measurement Theories 756
When to Use Higher-Order Factor Analysis 757
Multiple Groups Analysis 758
Measurement Model Comparisons 758
Structural Model Comparisons 763
Measurement Bias 764
Model Specification 764
Model Interpretation 765
Relationship Types: Mediation and Moderation 766
Mediation 766
Moderation 770
Longitudinal Data 773
Additional Covariance Sources: Timing 773
Using Error Covariances to Represent Added Covariance 774
Partial Least Squares 775
Characteristics of PLS 775
Advantages and Disadvantages of PLS 776
Choosing PLS Versus SEM 777
Summary 778 . Questions 781 . Suggested Readings 781
References 782
Index 785
· · · · · · (收起)
讀後感
就MDS and Correspondence Analysis 那一章来说,写得令我失望之极。整整有5页都在反复啰嗦MDS数据的收集的特点,书中出现好几个表现对象相似性的图,竟然没有一处仔细说明每个点 是怎么来的,难道是要从本章后面的论文中才能获得其中的步骤么? 到手的时候,厚厚一本书 估摸...
評分就MDS and Correspondence Analysis 那一章来说,写得令我失望之极。整整有5页都在反复啰嗦MDS数据的收集的特点,书中出现好几个表现对象相似性的图,竟然没有一处仔细说明每个点 是怎么来的,难道是要从本章后面的论文中才能获得其中的步骤么? 到手的时候,厚厚一本书 估摸...
評分就MDS and Correspondence Analysis 那一章来说,写得令我失望之极。整整有5页都在反复啰嗦MDS数据的收集的特点,书中出现好几个表现对象相似性的图,竟然没有一处仔细说明每个点 是怎么来的,难道是要从本章后面的论文中才能获得其中的步骤么? 到手的时候,厚厚一本书 估摸...
評分就MDS and Correspondence Analysis 那一章来说,写得令我失望之极。整整有5页都在反复啰嗦MDS数据的收集的特点,书中出现好几个表现对象相似性的图,竟然没有一处仔细说明每个点 是怎么来的,难道是要从本章后面的论文中才能获得其中的步骤么? 到手的时候,厚厚一本书 估摸...
評分就MDS and Correspondence Analysis 那一章来说,写得令我失望之极。整整有5页都在反复啰嗦MDS数据的收集的特点,书中出现好几个表现对象相似性的图,竟然没有一处仔细说明每个点 是怎么来的,难道是要从本章后面的论文中才能获得其中的步骤么? 到手的时候,厚厚一本书 估摸...
用戶評價
年度最佳好書,特彆詳細,寫論文的利器
评分年度最佳好書,特彆詳細,寫論文的利器
评分任何想入門數據分析的人都不應該錯過的書,做social science research的必讀課本,通讀之後在methodology方麵會有necessary的知識去讀懂paper,然後你就入門瞭,進階什麼的看個人造化吧。怎麼強調這本書的重要性也不為過,treat as Bible也行。另外,本書有大量企業感興趣的分析方法,比如cluster analysis。
评分年度最佳好書,特彆詳細,寫論文的利器
评分任何想入門數據分析的人都不應該錯過的書,做social science research的必讀課本,通讀之後在methodology方麵會有necessary的知識去讀懂paper,然後你就入門瞭,進階什麼的看個人造化吧。怎麼強調這本書的重要性也不為過,treat as Bible也行。另外,本書有大量企業感興趣的分析方法,比如cluster analysis。
相關圖書


本站所有內容均為互聯網搜索引擎提供的公開搜索信息,本站不存儲任何數據與內容,任何內容與數據均與本站無關,如有需要請聯繫相關搜索引擎包括但不限於百度,google,bing,sogou 等
© 2025 book.quotespace.org All Rights Reserved. 小美書屋 版权所有