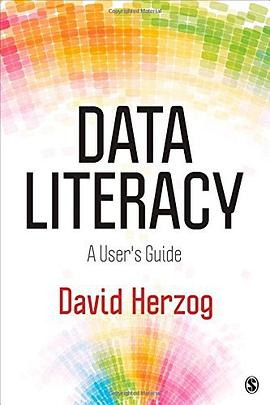

具体描述
作者简介
目录信息
Chapter 1: Data Defined Climbing the pyramid
A brief history of the data world
Data file formats
Chapter 2: Clues for uncovering data
Why agencies collect, analyze, publish data
Clues from data entry
Clues from reports
Tricks to uncover forms and reports
On your own
Chapter 3: Online databases
Destination: data portals
Statistical stockpiles
Agency sites
Non-governmental resources
Data search tricks
Don't forget the road map
On your own
Chapter 4: Identifying and requesting offline data
Other clues for offline data
Find the data nerd
Requesting the data
Writing the data request
FOIA in action
Negotiating through obstacles
Getting help
On your own
Chapter 5: Data dirt is everywhere
All data are dirty
Detecting dirt in agricultural data
Changed rules = changed data
On your own
Chapter 6: Data integrity checks
Big-picture checks
Detailed checks
On your own
Chapter 7: Getting your data in shape
Column carving
Concatenate to paste
Date tricks Power scrubbing with OpenRefine
Extracting data from PDFs
On your own
Chapter 8: Number summaries and comparisons
Simple summary statistics
Compared to what?
Benchmarking
On your own
Chapter 9: Calculating summary statistics and number comparisons
Sum crimes by year
Minimum and maximum numbers
Amount change
Stepping up to percent change
Running rates
Running ratios
Percent of total
More summarizing
On your own
Chapter 10: Spreadsheets as database managers
Sorting
Filtering records
Grouping and summarizing
On your own
Chapter 11: Visualizing your data
Data visualization defined
Some best practices
Chapter 12: Charting choices
Visualizing data with charts
On your own
Chapter 13: Charting in Excel
Pie chart
Horizontal bar charts
Column and line charts
Scatterplot
Stock chart
Sparklines
On your own
Chapter 14: Charting with Web tools
Online visualization options
Evaluating web visualization platforms
Creating Fusion Table charts
On your own
Chapter 15: Taking analysis to the next level
Database managers
Statistical programs
· · · · · · (收起)
读后感
评分
评分
评分
评分
评分
用户评价
评分
评分
评分
评分
评分
相关图书
本站所有内容均为互联网搜索引擎提供的公开搜索信息,本站不存储任何数据与内容,任何内容与数据均与本站无关,如有需要请联系相关搜索引擎包括但不限于百度,google,bing,sogou 等
© 2026 book.quotespace.org All Rights Reserved. 小美书屋 版权所有


